Elvin Conversations
The Conversations Analytics section is where you can monitor how users interact with Elvin Copilot. You can track conversation volumes and resolution rates, review user feedback, and explore how topics are distributed through labels. When needed, you can also drill down into individual conversations to read the full transcript, check which sources Elvin used to generate a response, and report any hallucinations you come across.
To access it, follow this link, or navigate to Elvin Copilot → Learn → Conversations.
Metrics
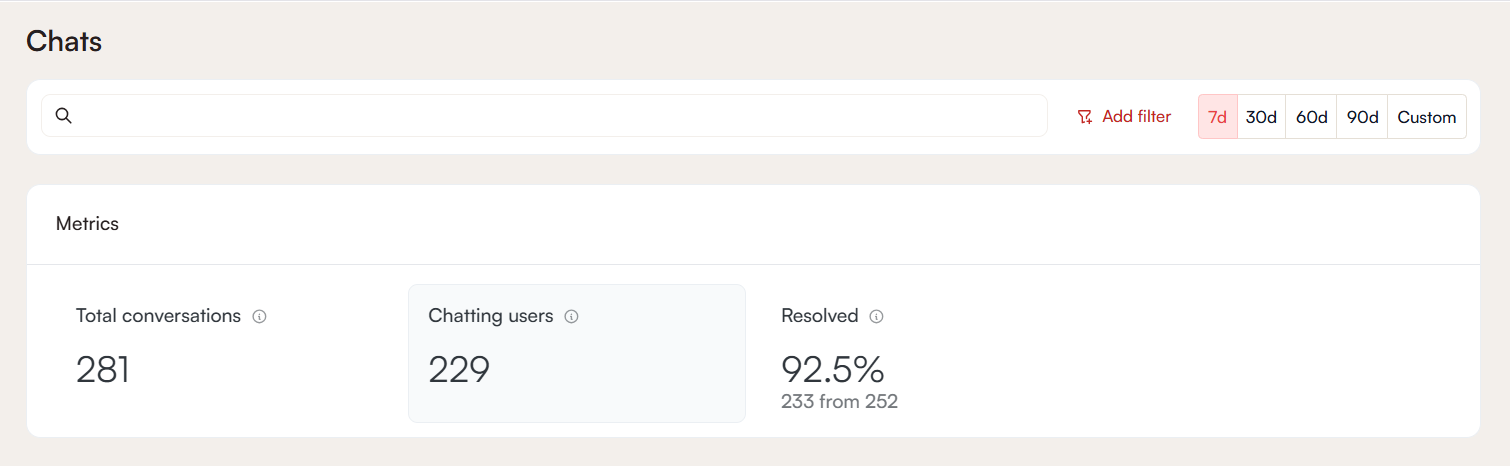
The metrics panel provides three essential performance indicators:
Total Conversations
The number of conversations initiated during the selected time range. This counts conversations as units, not the number of individual messages exchanged within them.
Chatting Users
The total number of distinct users who had at least one conversation with Elvin Copilot in the selected time range. Multiple conversations from the same user are counted once.
Resolved Conversations
The number of conversations that ended with a resolved status. This is shown as both an absolute number and as a percentage of total conversations.
Metrics Data Visualization
The Visualization section displays graphs representing conversation activity and user interactions over time. Each key metric can also be represented visually on a graph. To access this section, click on any of the metrics.
The Total Conversations and Chatting Users metrics can be displayed together on the same graph by selecting both of them simultaneously.
The Show Values option overlays the exact numerical values directly onto the graph for a more precise reading.
Data can be grouped by different levels of granularity: daily, weekly, monthly, quarterly, or yearly intervals. This allows you to view both short-term fluctuations and long-term patterns depending on the selected time range and grouping.
Labels
Labels are tools that categorize conversations so you can understand what topics are being discussed and how those topics change over time. This feature works by Elvin AI interpreting and assigning labels to conversations after they are closed (either Resolved or Escalated), 24 hours after the last message.
There are 2 types of labels:
- Custom labels: created by workspace admins to track specific topics that matter to your team
- Automatic labels: generated by the system and assigned automatically based on conversation content
Custom Labels
Custom labels are created by workspace admins. You can create a maximum of 5 Custom labels per workspace. Only users with Admin permissions can create, edit, delete, or clone them, but all users in the workspace can view them. Custom labels are visually distinct and always displayed before Automatic labels.
How to Create a Custom Label
Custom labels are created and managed in the Top Labels section. If no custom labels have been created yet, you will be prompted to create one via a direct link. To add more labels, click the + icon.
When creating a Custom label, two fields are required:
- Name: should be concise, clear and descriptive
- Description: a short, but descriptive explanation of what should be tracked.
Once saved, the label is immediately active, but applies only to conversations closed after its creation. There is no retroactive recalculation.
How to Manage Custom Labels
To edit or delete a Custom label, click Manage Custom Labels and select the one you wish to edit.
Note that modifying a Custom label treats the updated version as a new label, past conversations retain the original label, and the new definition applies only to conversations closed after the change.
Automatic Labels
Automatic labels are generated by Elvin AI, which analyzes each conversation and assigns the most relevant ones. A conversation can receive multiple automatic labels, and unlike custom labels, they cannot be manually edited.
In lists and charts, Automatic Labels appear after custom labels.
Top Labels
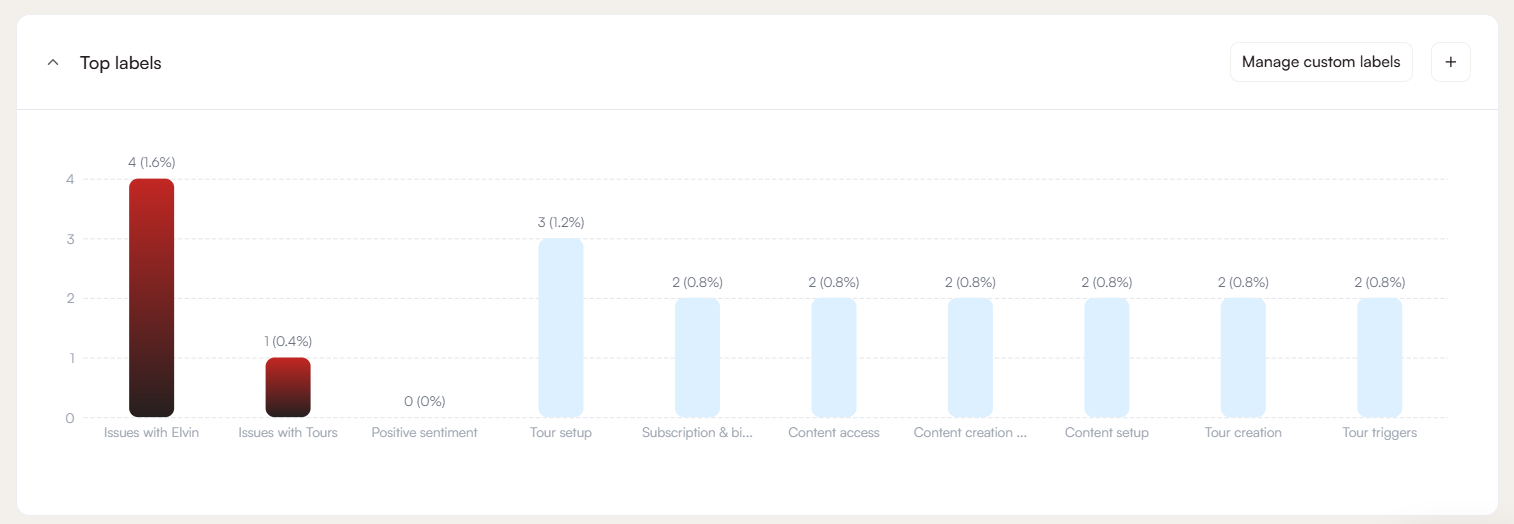
Top Labels is a histogram showing the most common labels for the selected time period. Custom and Automatic labels are shown separately with Custom labels being positioned first.
When hovering over a bar, the system displays the number of conversations the label appears in and the percentage of total conversations for that period.
Selecting one or more labels filters both the chart and the conversation list. The chart then shows only data related to the selected labels. The selected time range affects the histogram.
Label Mix Over Time
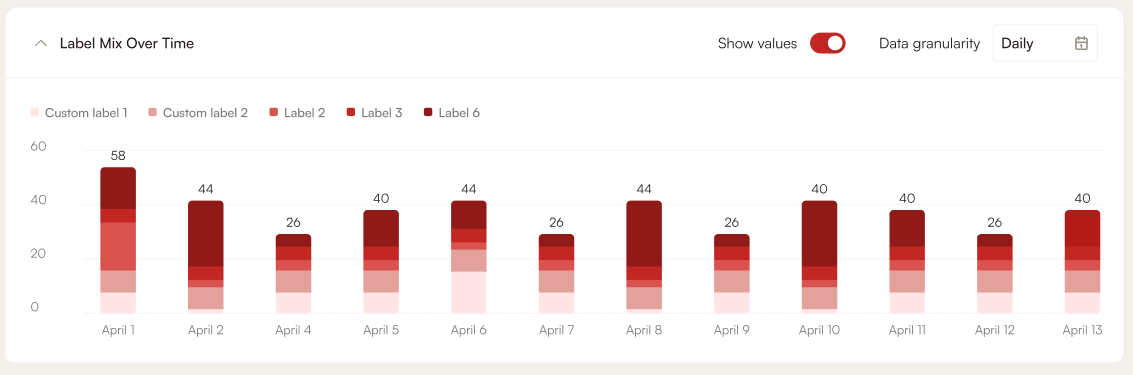
Label Mix Over Time is a stacked chart showing how label distribution changes across the selected time period. Both Custom and Automatic labels are included. Each bar represents a time segment based on the selected data granularity.
When hovering over a segment, the system displays the total number of conversations in that period, a breakdown by label, and the count and percentage for each label. Selecting specific labels updates the visualization to show only those labels. The selected time filter applies here as well.
Conversation Table
Below the graphs, a detailed conversation table lists each recorded conversation individually. The table includes the following columns:
- Conversation Title: the initial user query that started the conversation
- Date: the date when the conversation occurred
- Messages Count: the total number of messages exchanged in the conversation
- Upvotes and Downvotes: the recorded user feedback on response quality
- Manual Review: Admins can set the review status
- Status: resolved, escalated, or pending evaluation
Clicking a label in the conversation list filters the view to show only conversations with that label.
Detailed Conversation Analysis
Clicking on a conversation entry opens a tab with further information:
This view shows the full transcript of the conversation, including both user messages and Elvin's responses, so that the entire interaction can be reviewed in context.
In this tab, you can see the entire conversation flow and review the feedback left on individual messages. Each message may have its own rating, so one response might be upvoted while the next is downvoted.
If you click the Investigate Answer button, it will show you the exact sources Elvin used to generate the response, including the annotations, articles, and the specific paragraph or information referenced.

Quality Control Tools
You can evaluate the quality of Elvin's answers by reviewing the sources that were used to generate them. By tracing responses back to their sources, you can better understand why certain answers were produced, improve the underlying source material, and reduce hallucinations.
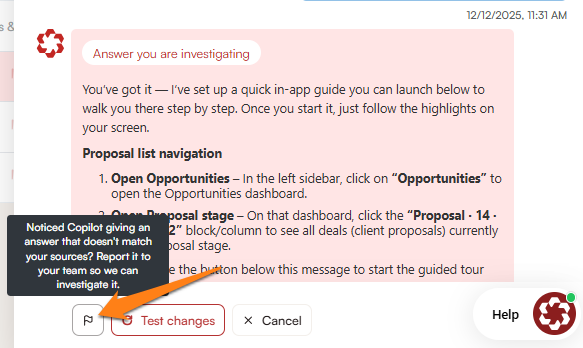
If you find that your sources are correct, coherent, and clear, but Elvin has still generated a hallucinated response, you can report it directly using the Report hallucination button at the bottom of the response.
Time Range Selection
By default, the analytics dashboard displays data for the last 7 days, offering a quick way to view the most recent usage patterns.
The time range can be changed using the selector in the top-right corner of the screen:
- Predefined ranges: 30, 60, or 90 days
- Custom range: select a specific start and end date to focus on a particular period
Selecting a shorter range (for example, 7 or 30 days) is useful when you want to check the effect of recent changes or updates. Longer ranges (such as 60 or 90 days) are better when you want to identify patterns over time or compare activity across multiple months.
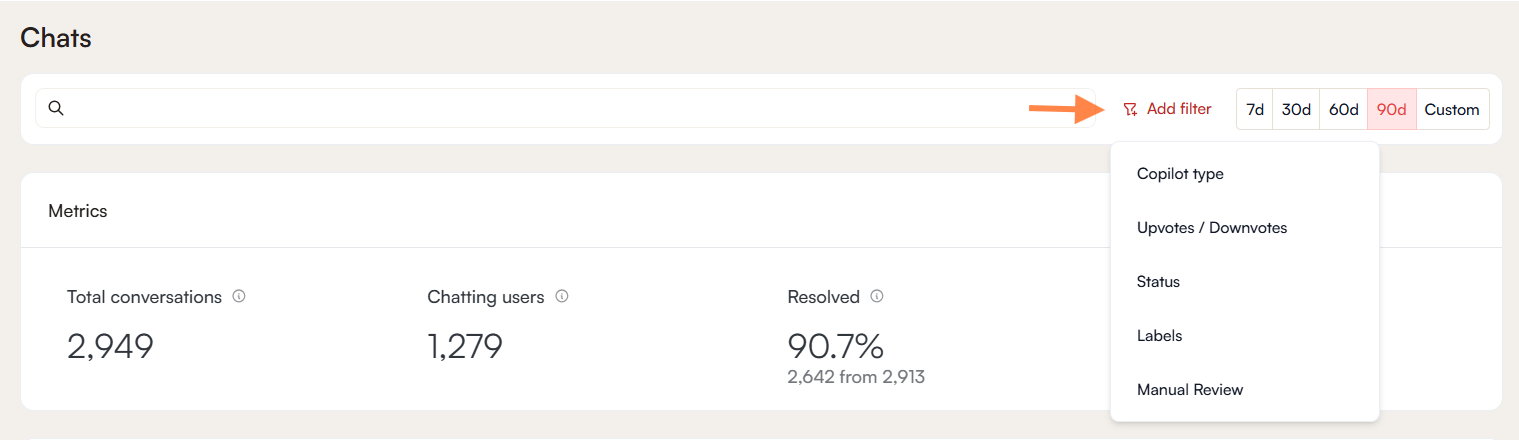
Filter
By default, all conversations are displayed. Filters can be applied to narrow down the list and focus on specific cases or patterns. Multiple filters can be combined for a more refined view.
- Copilot type: Filter by the type of copilot involved in the conversation: either Copilot (legacy) or Elvin
- Upvotes/Downvotes: Filter by user feedback, showing only conversations that received an upvote or a downvote.
- Status: Filter by conversation status: resolved, escalated, or pending evaluation.
- Labels: Filter by one or more labels, either automatic or custom, to surface conversations around a specific topic or issue
- Manual review: Filter by the review status assigned to a conversation by an admin