
Survey Analytics
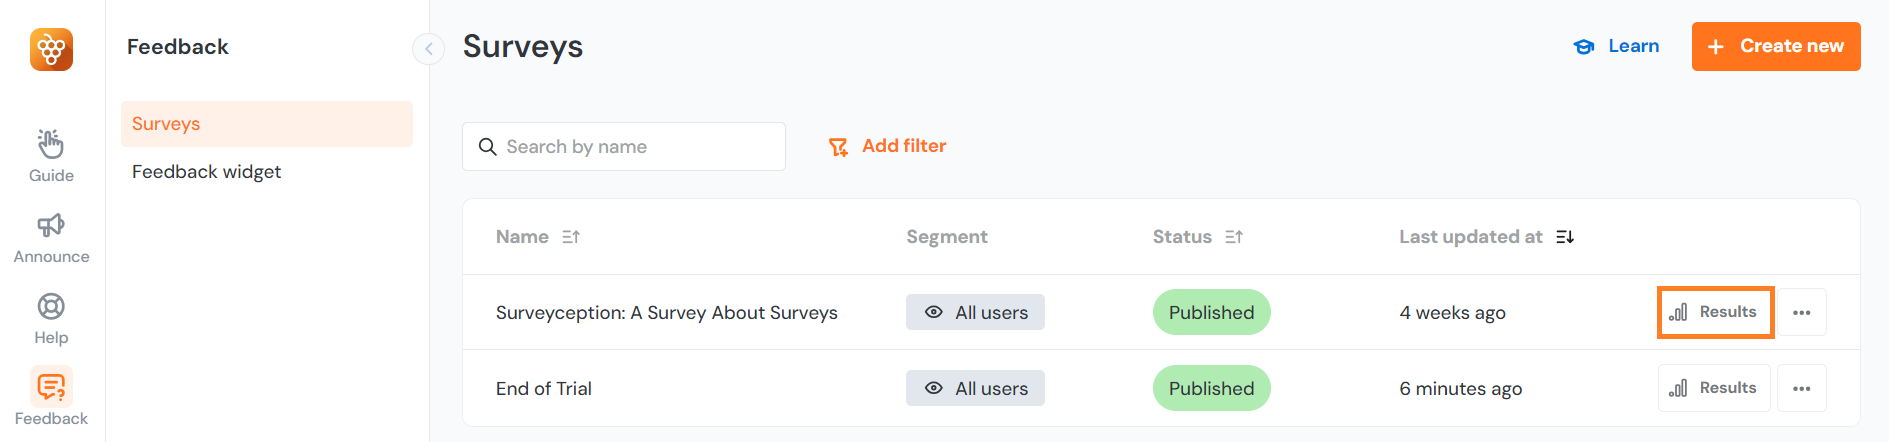
To view user feedback and survey results, go to User feedback > Surveys and select Results to see the corresponding survey data.
Answers
Under the Answers tab individual user responses are displayed in rows, along with the date and their answers to each question. If a question is left unanswered or blank, a dash (-) will be shown in place of the response.
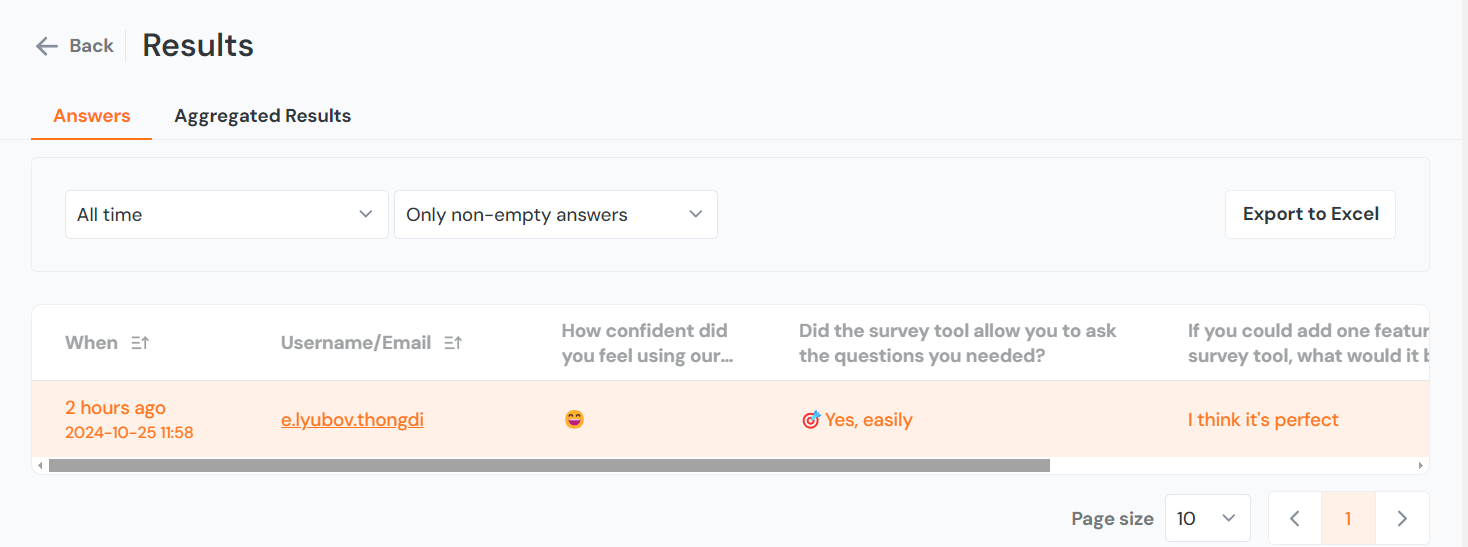
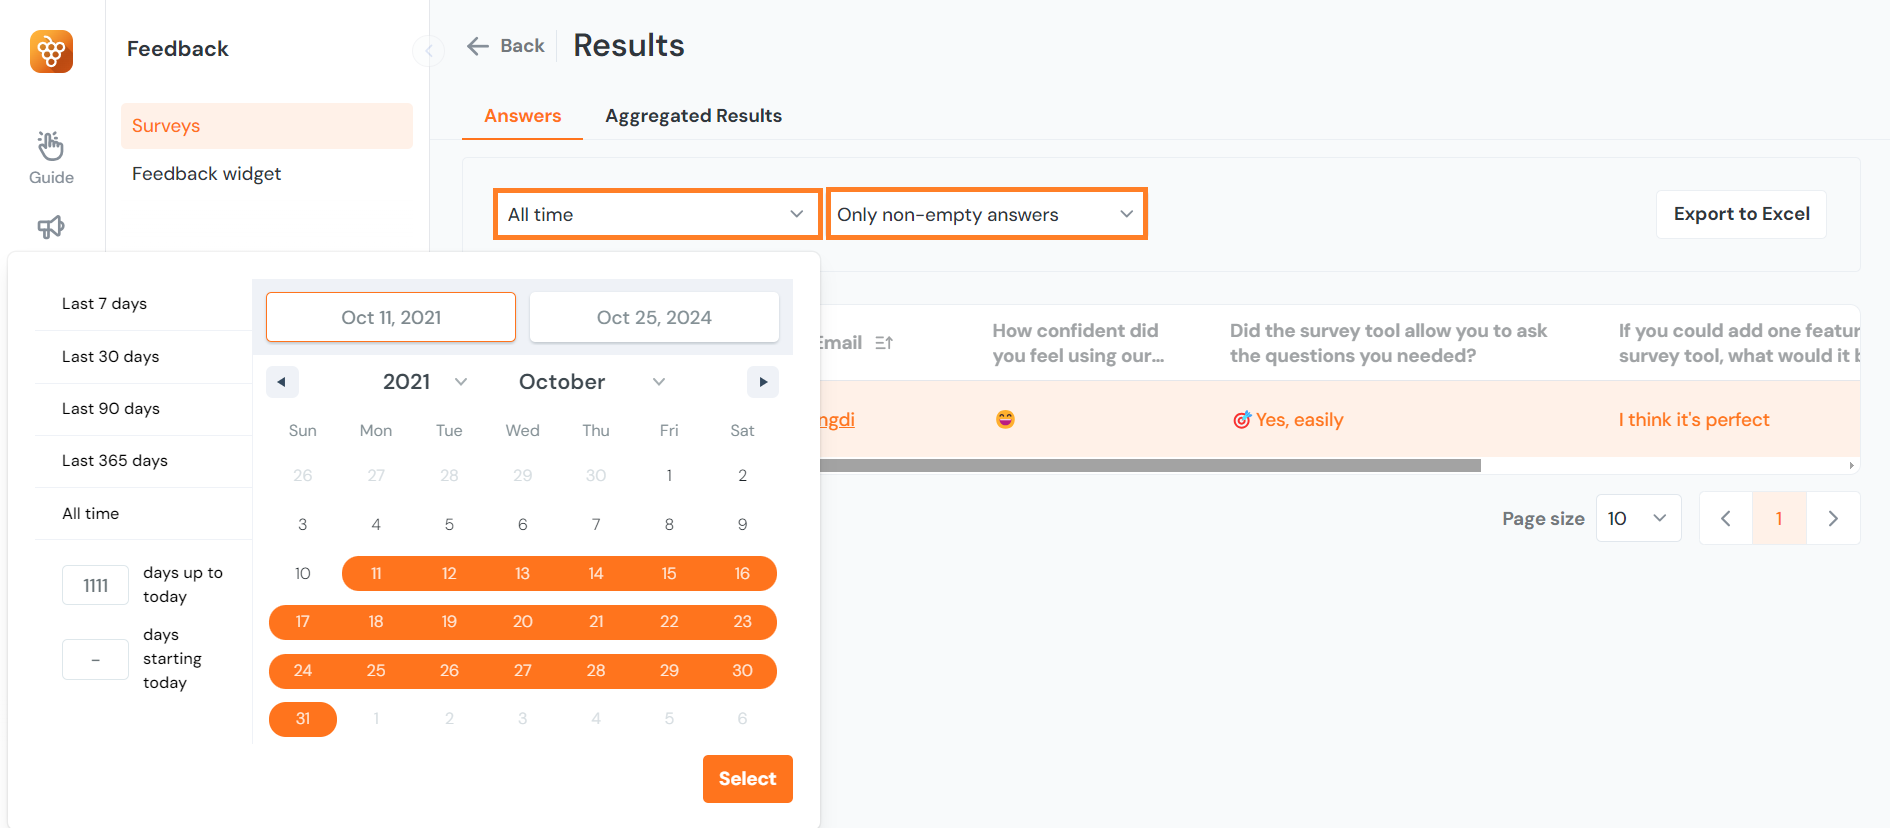
You can filter results by selecting a specific time period, such as the last 7 days or a custom range, as well as by response type, including all answers, only non-empty responses, or only empty ones.
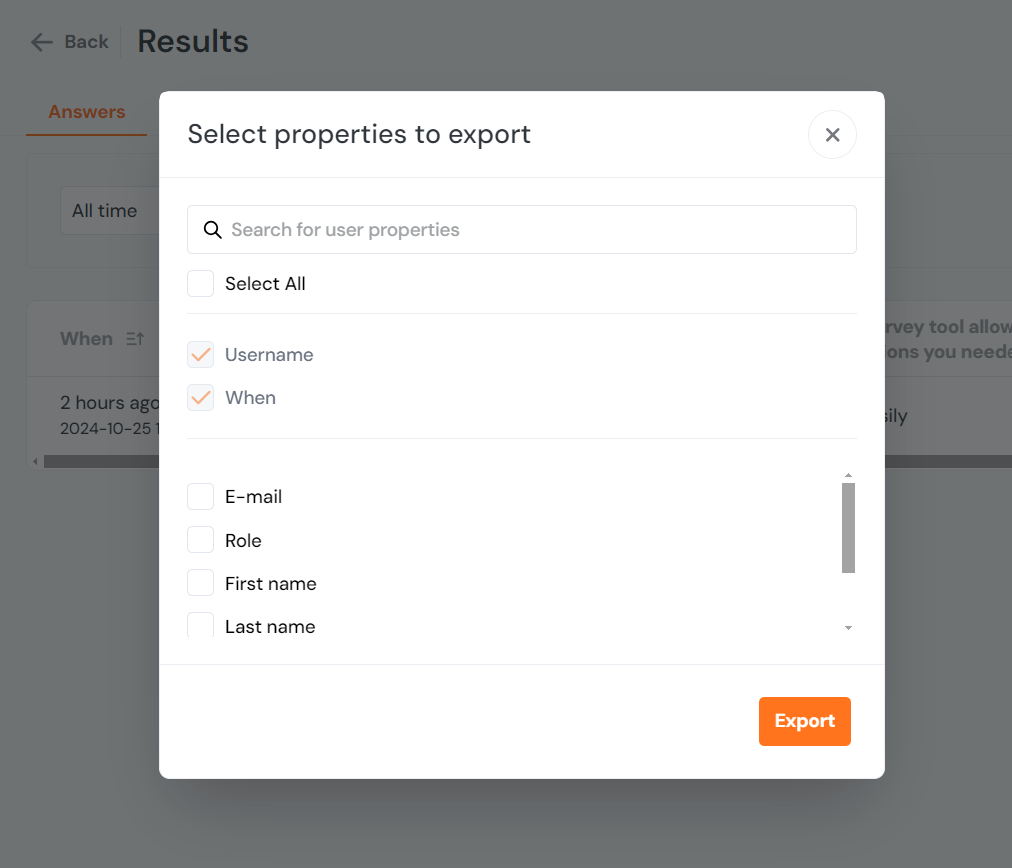
Additionally, you can export the answer data to Excel and choose which properties to include.
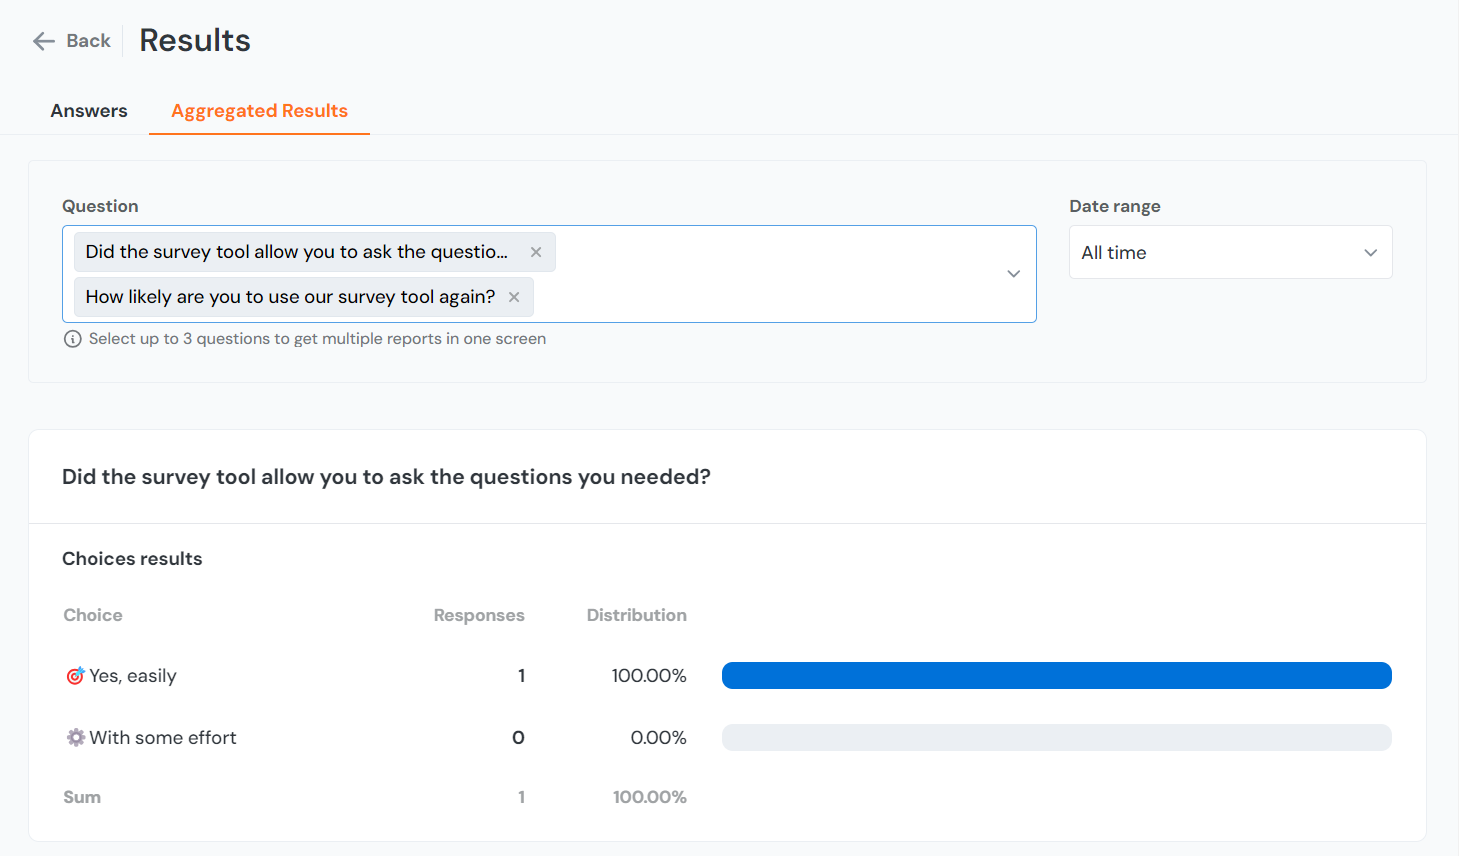
Aggregated Results
Aggregated Results offer a summarized view of survey data, enabling you to easily identify trends and insights. You can select up to three questions from your survey to visualize their responses through graphs or charts. Bar charts are used to display the results of emoji ratings, numeric ratings, and single or multiple-choice questions.
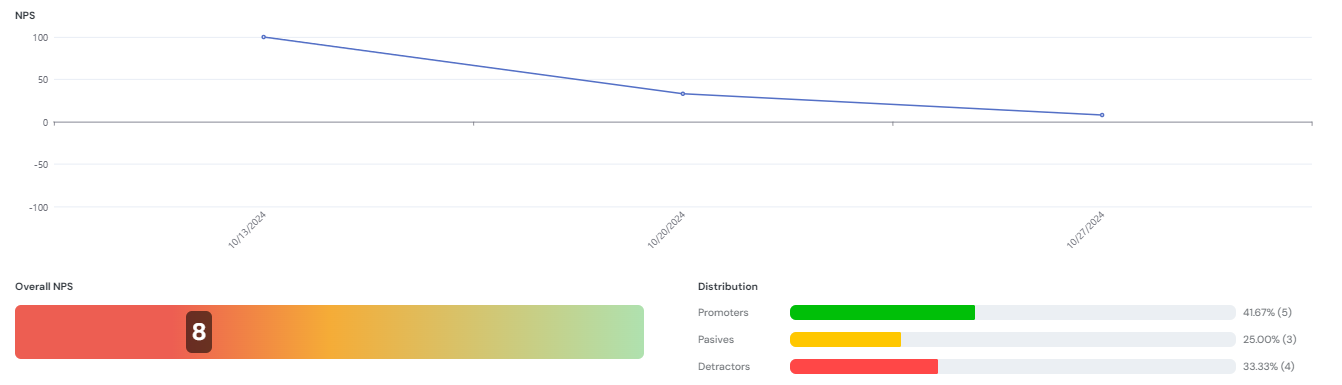
NPS (Net Promoter Score) is represented with both a distribution bar and a graph, highlighting the distribution of promoters, passives, and detractors.
For open-ended single-line and multi-line responses, a word cloud highlights the most frequently mentioned words, offering a quick snapshot of key themes in your feedback.