Hints Analytics
Hint analytics display a graph showing two metrics: Sum views, which is the total number of times the hint was viewed (including repeat views by the same user), and Unique views, which counts each user only once, no matter how many times they viewed the hint.
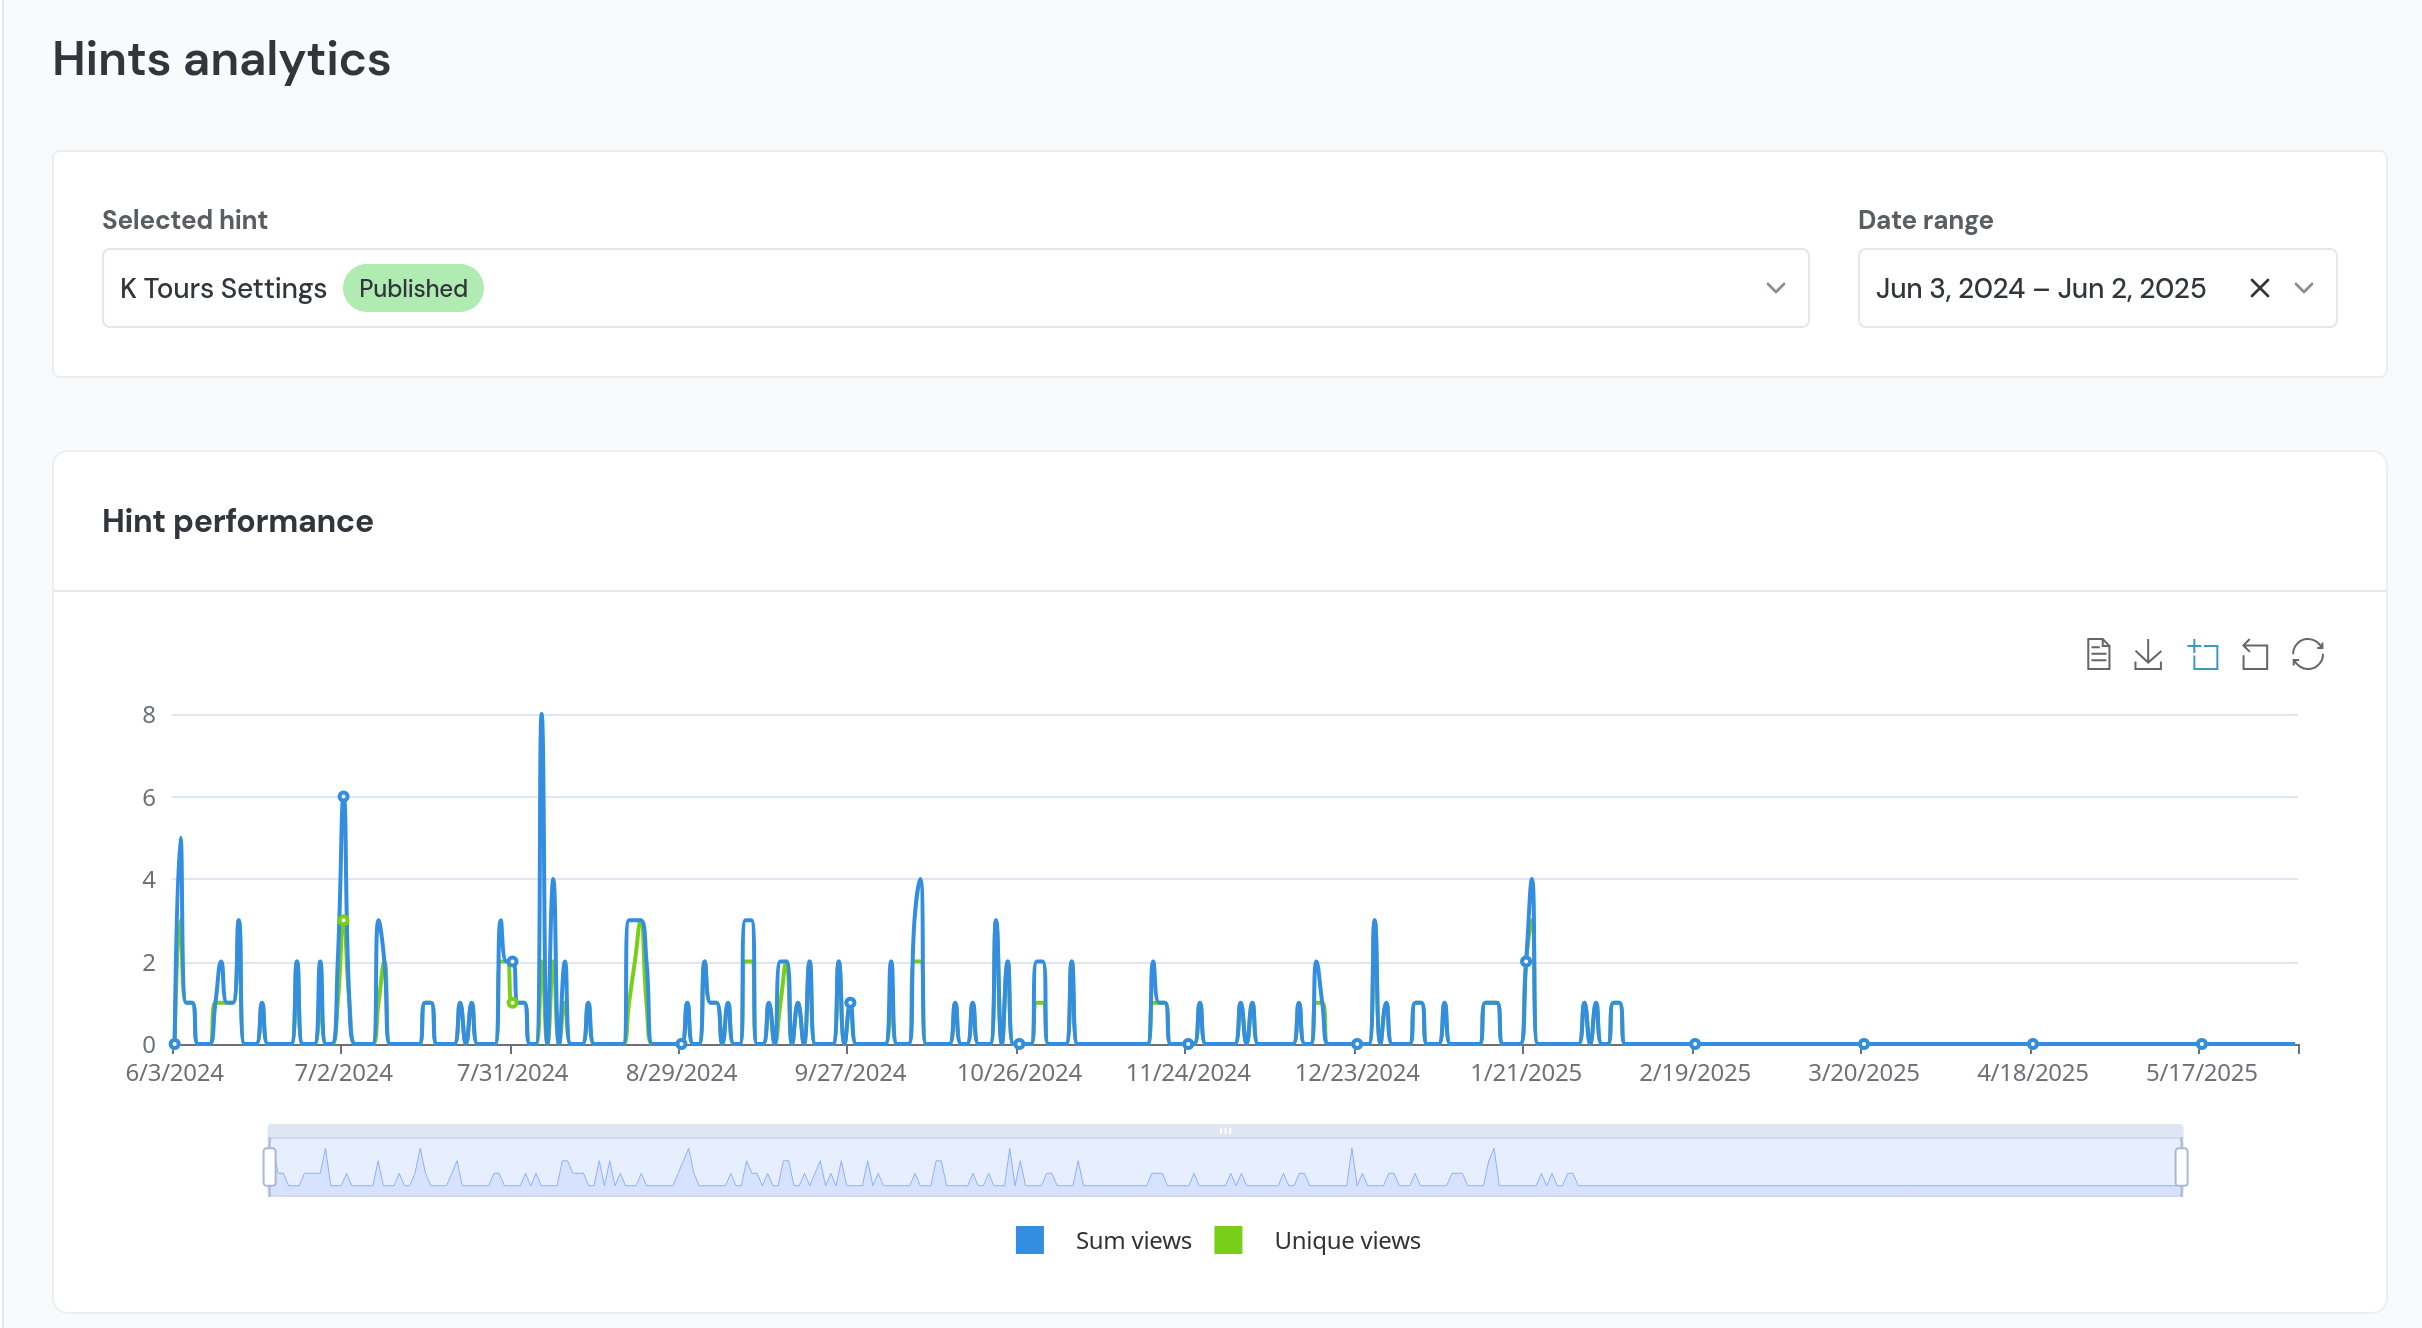
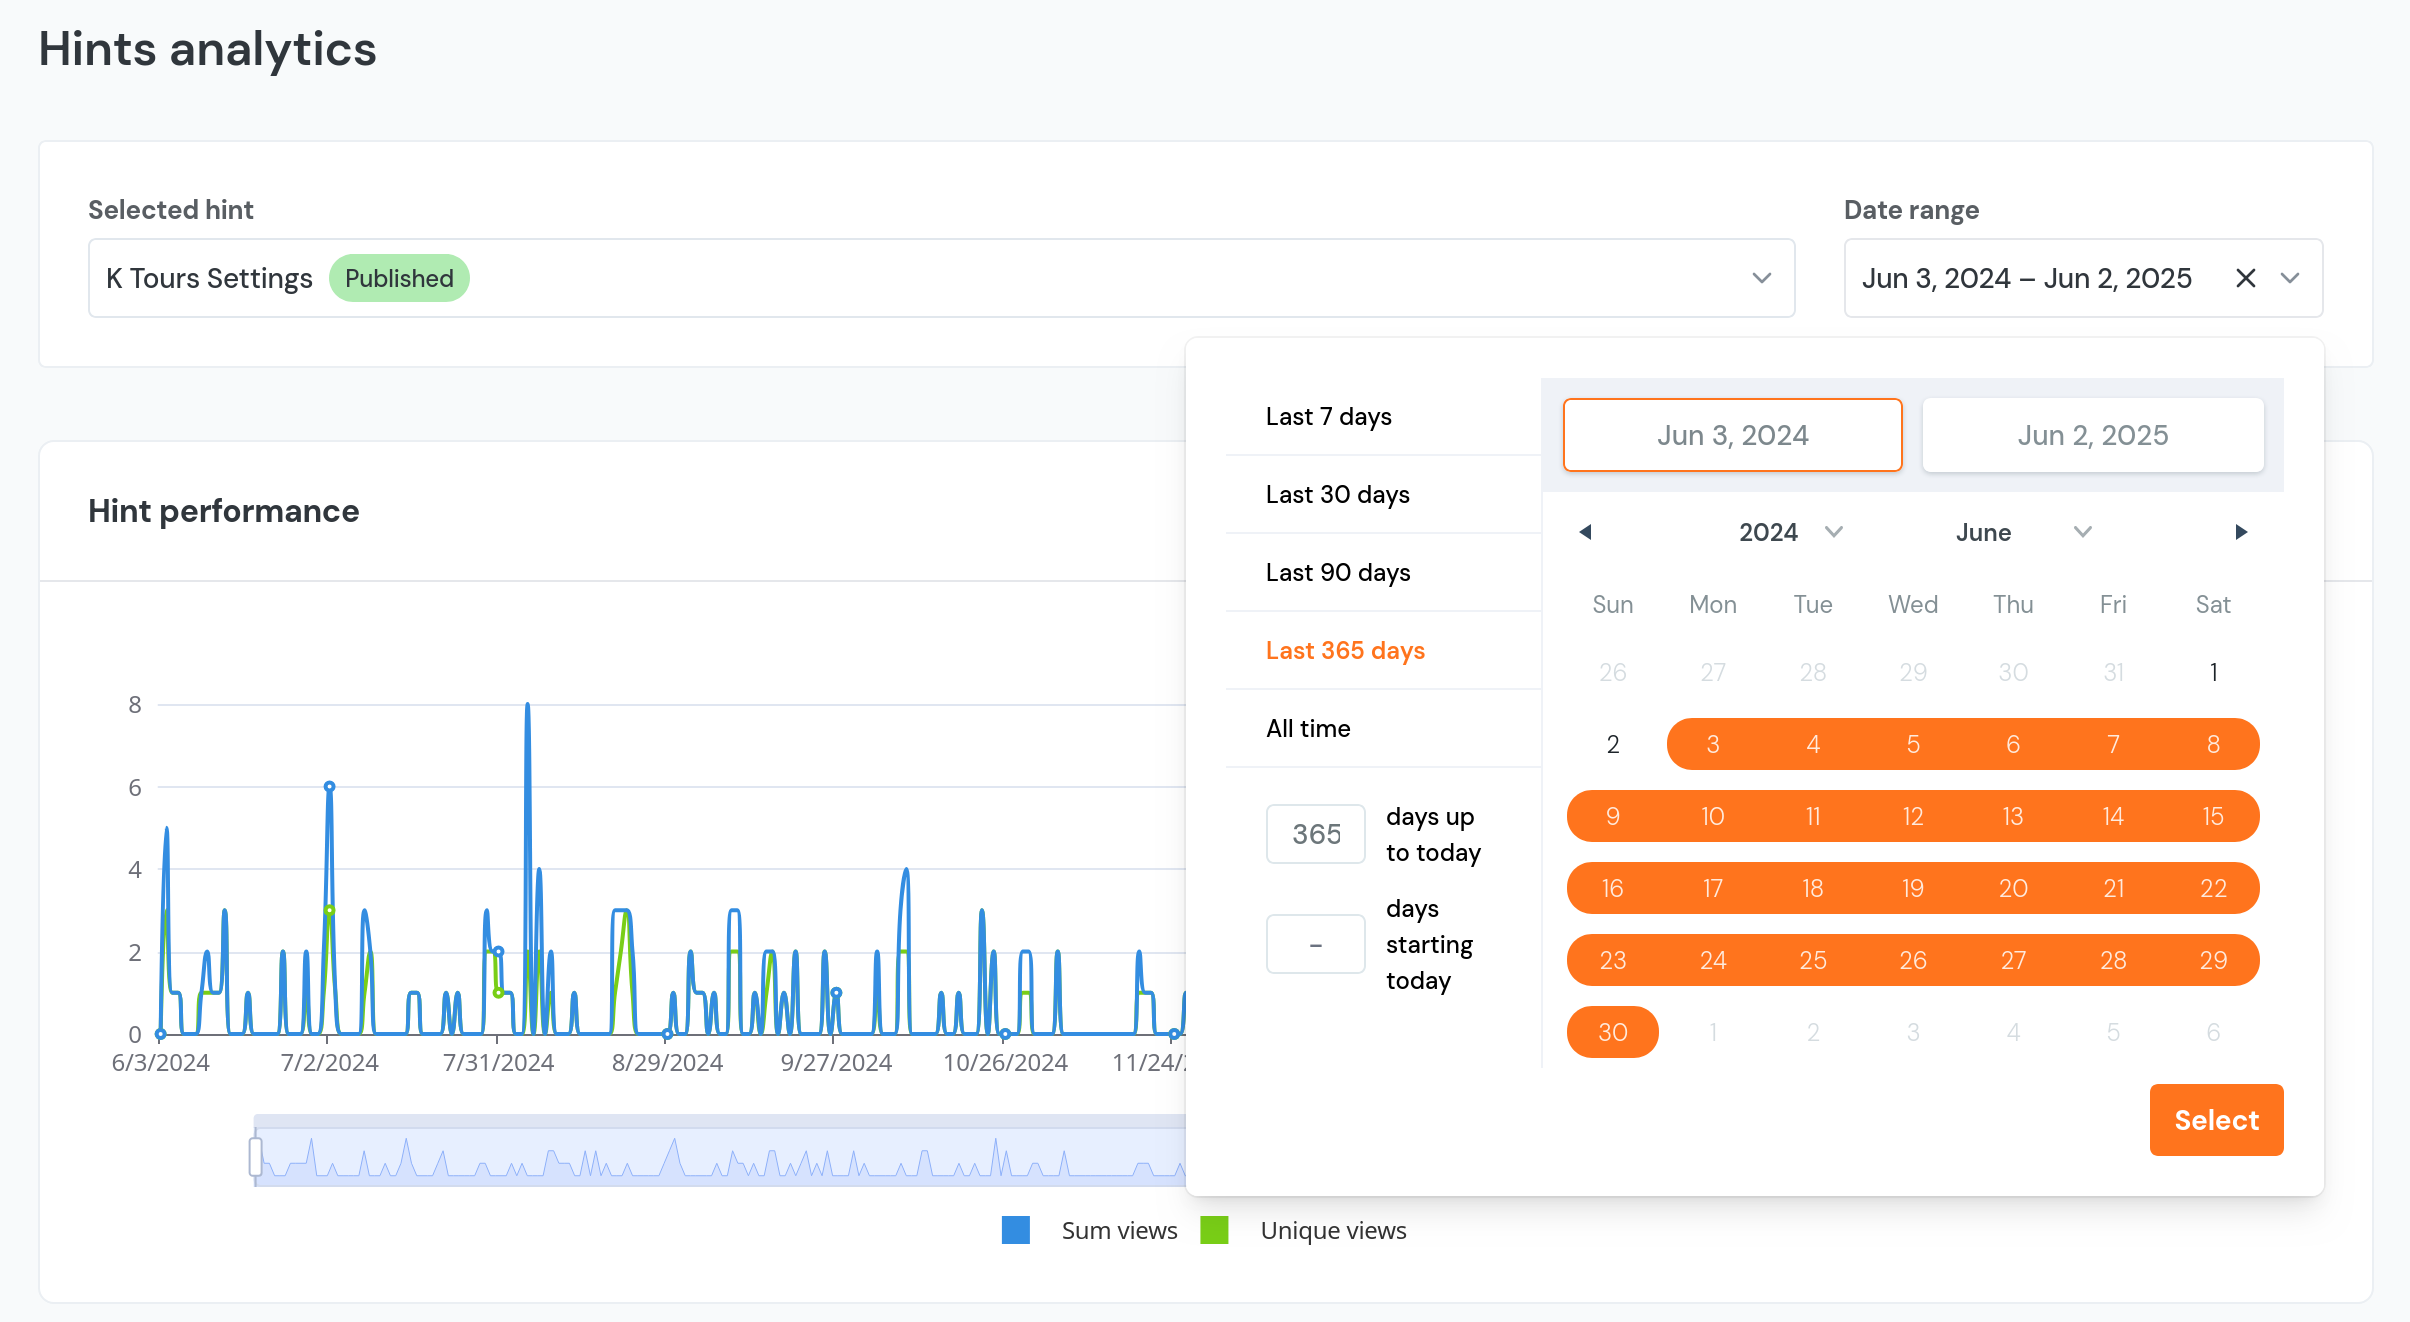
To get started, choose the hint you want to analyze from the dropdown menu. Keep in mind that, unlike tour analytics, you can only view one hint at a time, comparing multiple hints isn’t possible yet. After selecting a hint, pick the date range you’d like to explore. You can use one of the quick presets, like the last 7, 30, or 365 days, or easily set a custom range using the calendar.
Hint Performance
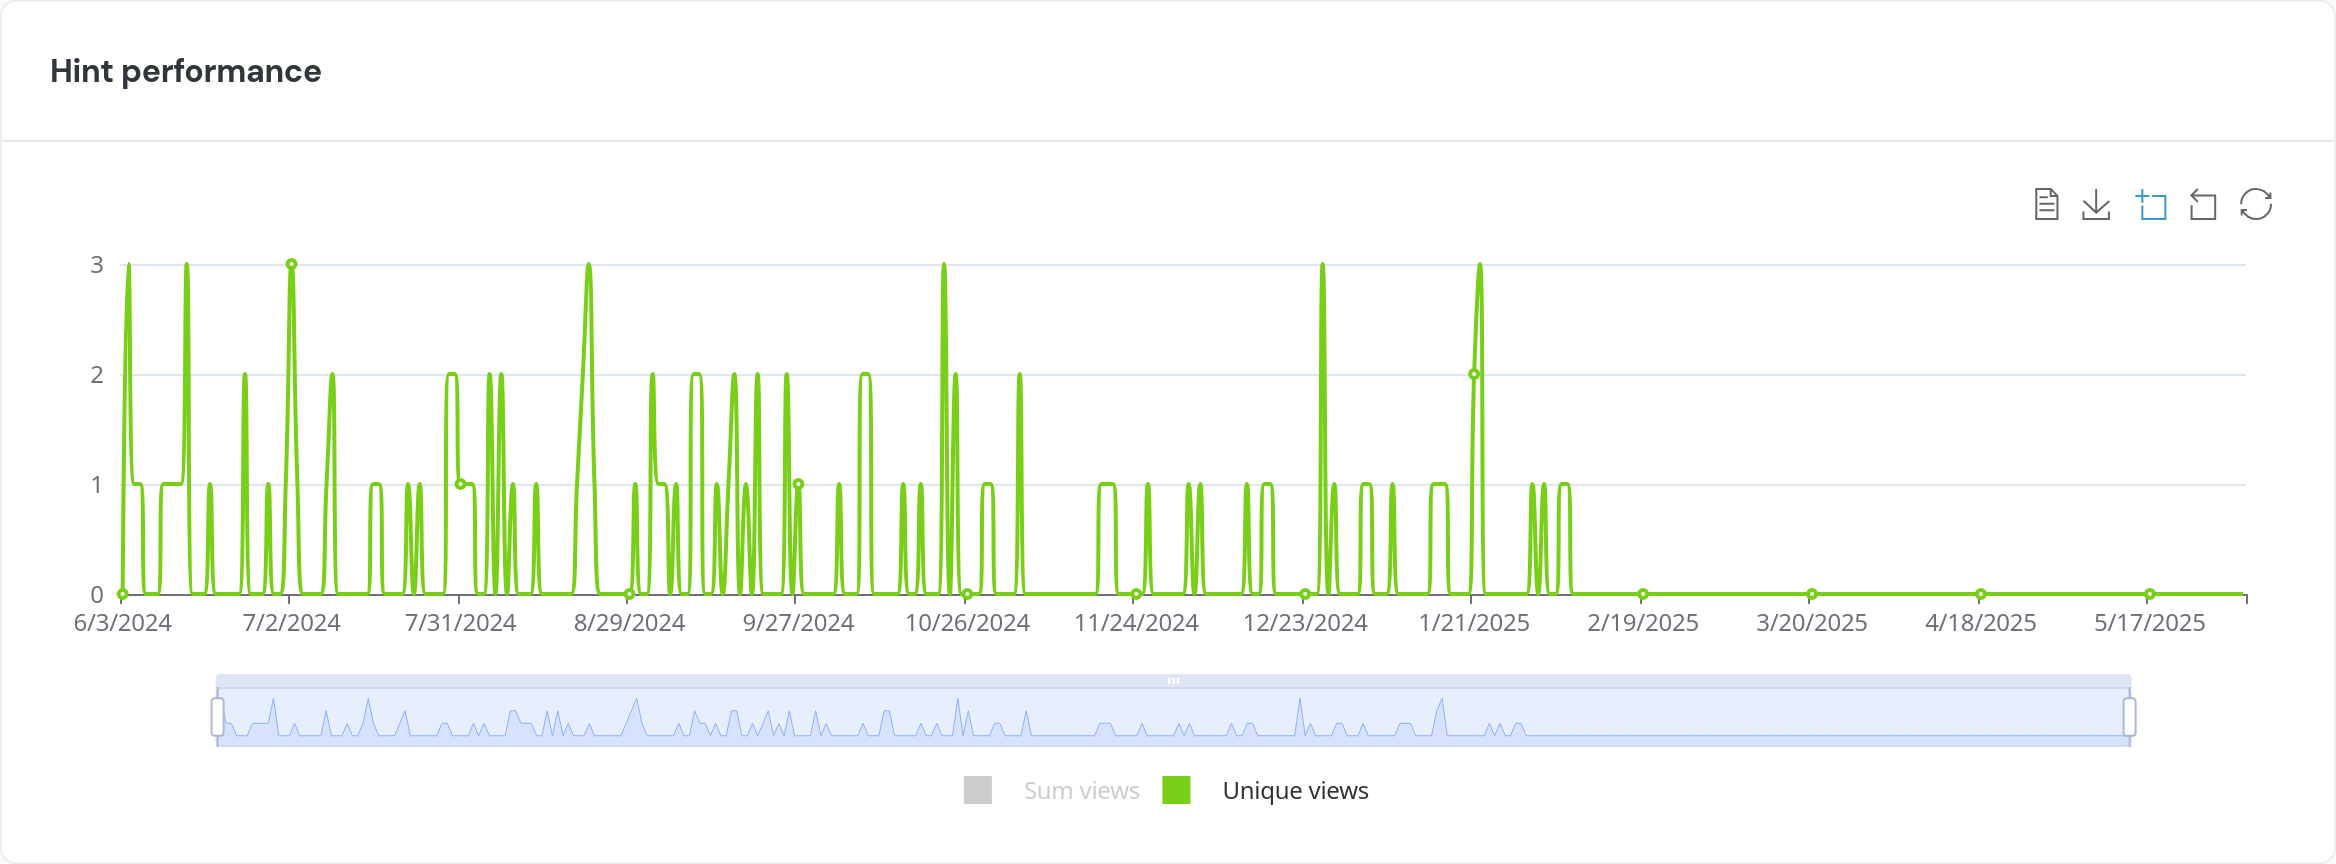
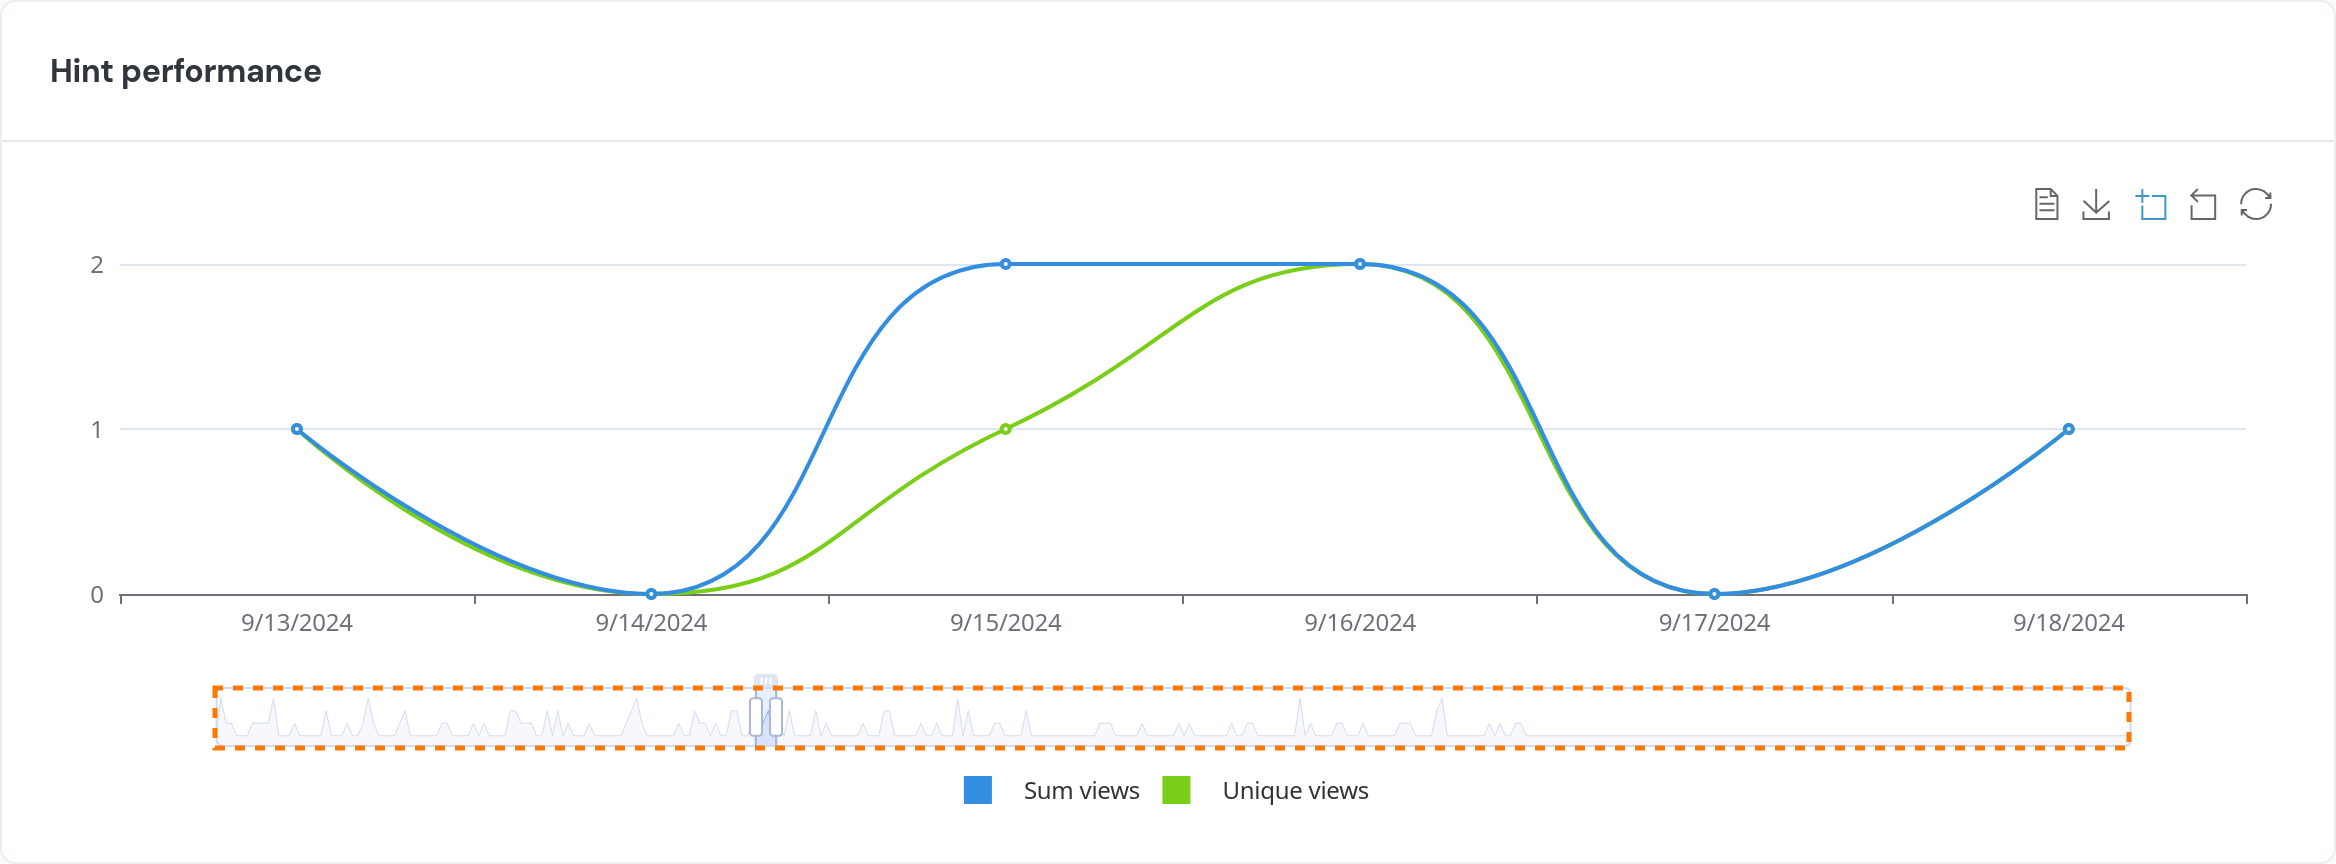
As mentioned earlier, the graph shows two metrics: the total number of times the hint was viewed (in blue) and the number of unique users who saw it (in green). If you'd like to focus on just one of these, simply click the label of the metric you don’t want to display, this will hide it and make the other stand out more clearly.
Below the graph, there’s a bar that lets you zoom in on specific parts of the selected date range. You can drag the edges to make the period longer or shorter, and scroll left or right to move through the timeline.
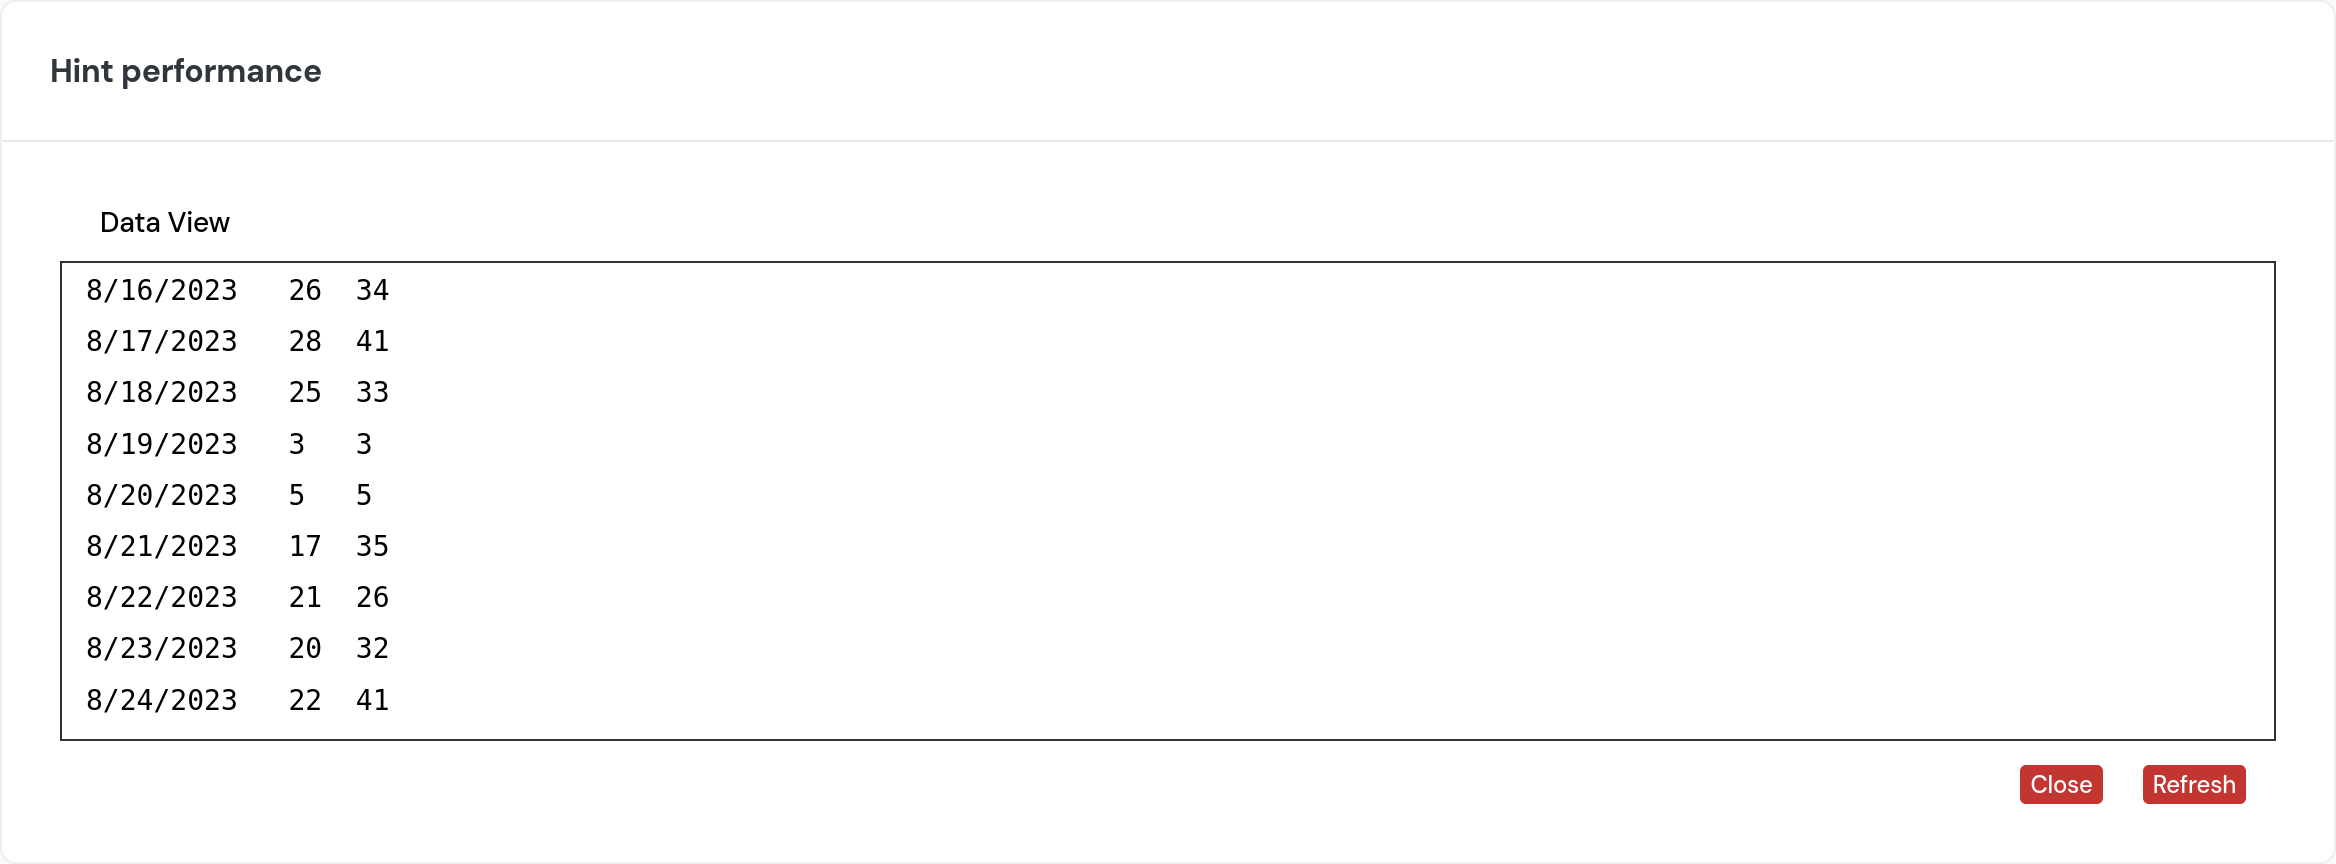
If you're not a fan of graphs, you can switch to the Data view (the paper icon located in the upper right corner of the graph) instead. This will display the information in a table format, showing the date along with the number of total and unique views, and this data can be copied for convenience.
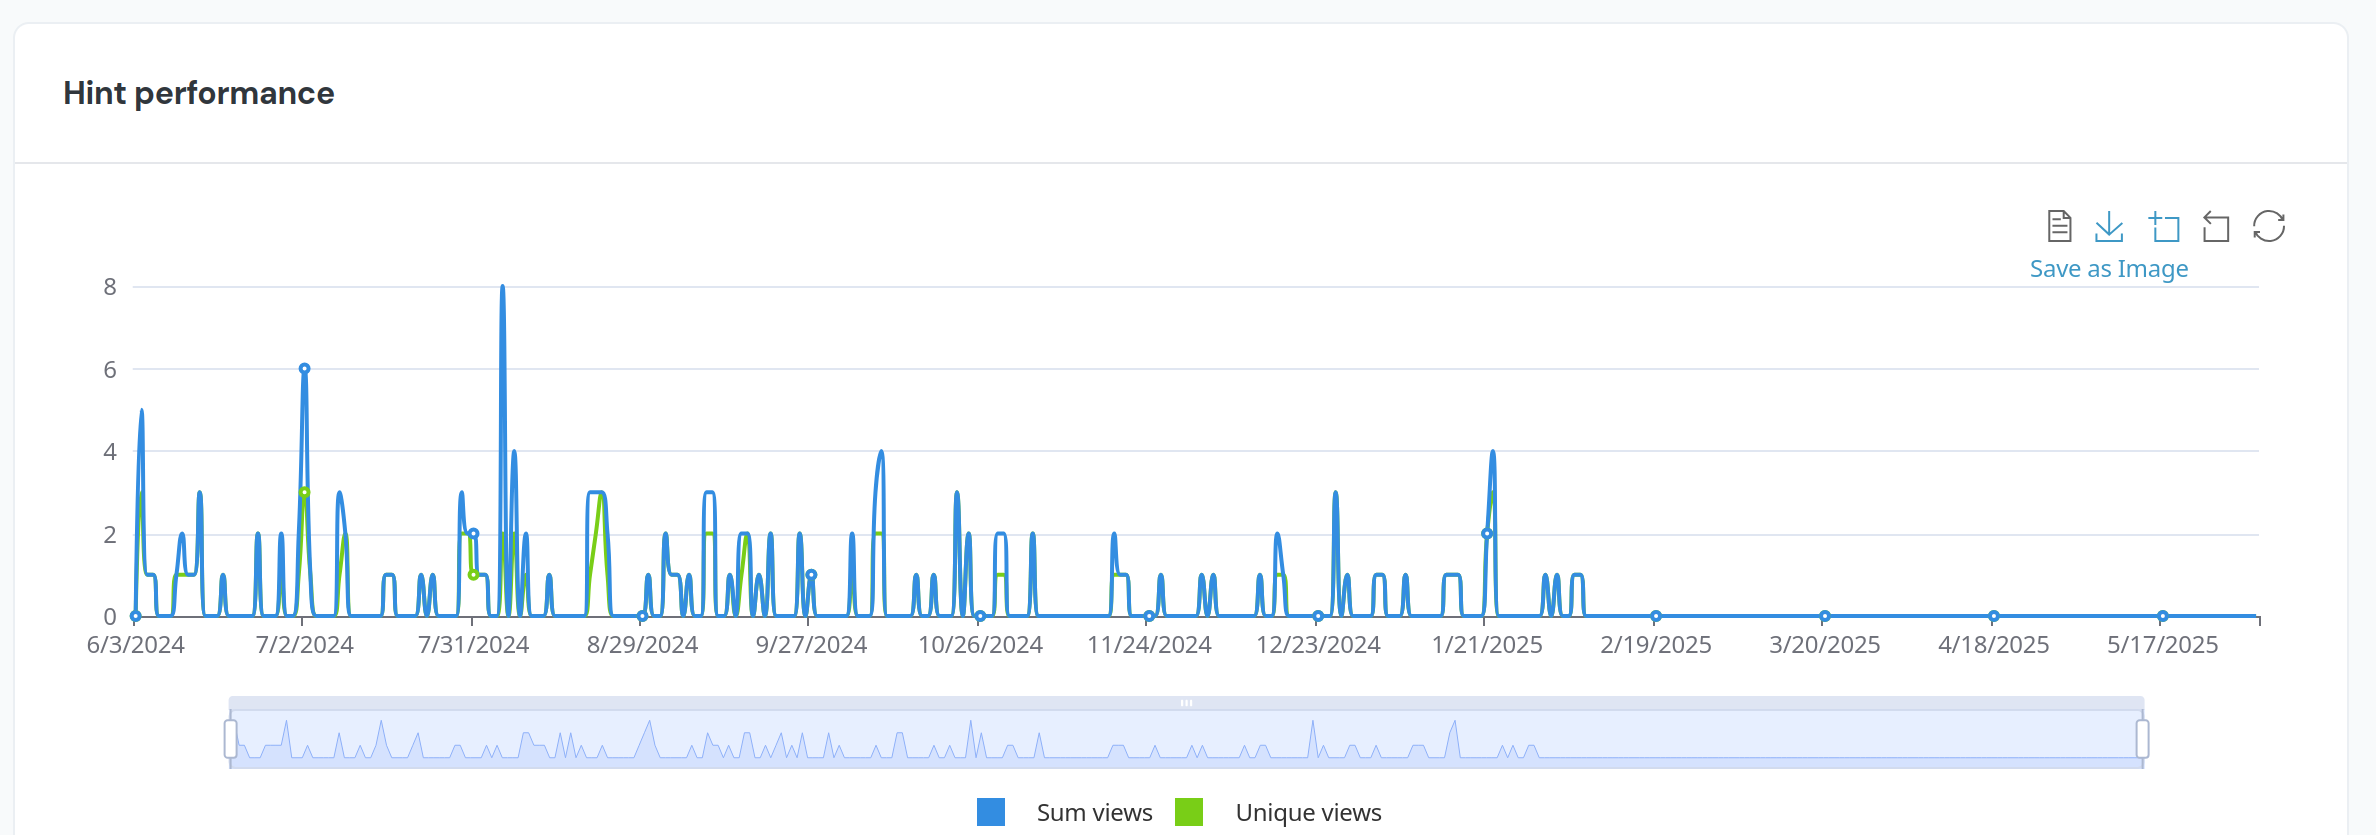
You can also export the graph as an SVG image by clicking the download icon located right next to the Data view option. It is saved the same way you are viewing it, i.e. if you have zoomed into part of the graph, it will save the zoomed in version.
Another useful feature is Zoom. It allows you to zoom into a portion of the graph that you select. You can zoom into the graph multiple times to narrow down the portion you'd like to view. Zoom reset will allow you to "zoom out" one time, while restore will change it back to the version showing your entire selected date range.
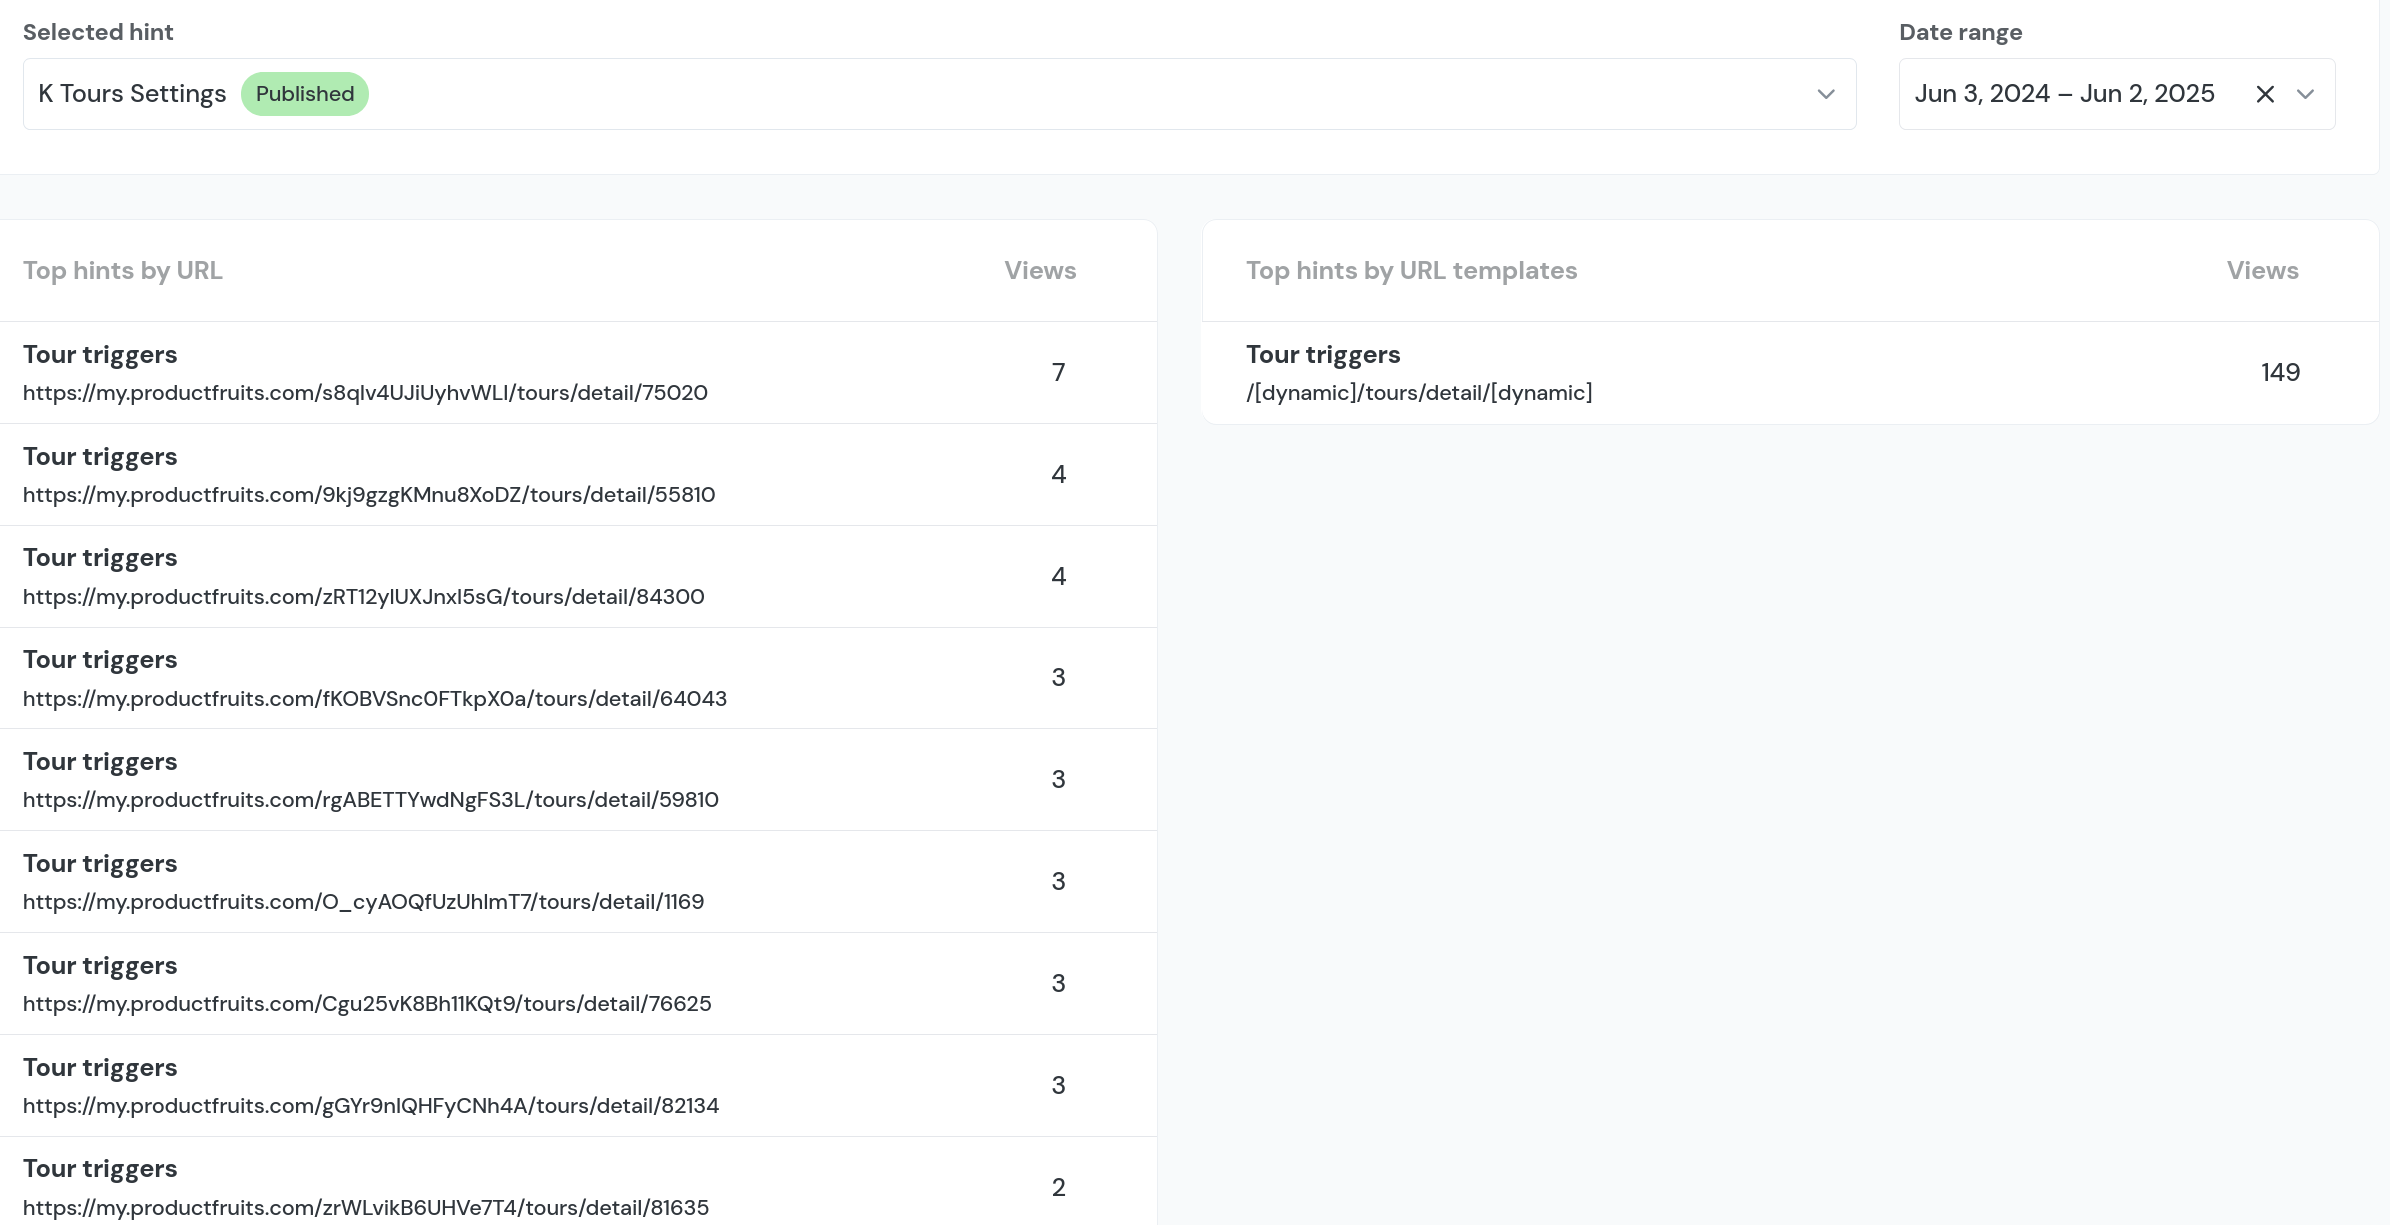
Top Hints by URL
Below the graph, you'll find two columns: Top Hints by URL and Top Hints by URL Template. The first shows a list of specific pages where each hint was triggered, including fully detailed URLs. The second groups those pages by structure, replacing dynamic parts (like IDs) with placeholders, helping you see how hints perform across similar types of pages.